


As Brits, we rarely talk about salaries and how much we earn. This means many of us don’t have a clue if we’re earning above or below the average salary in the UK. We wanted to change that.
To do so, we’ve reviewed the latest annual Government report, released in October 2024, via the Office for National Statistics (ONS), to create the most comprehensive guide to the salaries and the average wage in the UK. [1] We also took separate 2024 ONS data on pay to see how the average salary in the UK may change next year.
Our analysis will let you know if you’re getting a good deal or not.
Below you’ll find statistics on the average UK salary per gender, age, industry, and how these have changed over the years.
What is the average salary in the UK now?
The average salary in the UK is £31,602 but this doesn’t tell the full story of what Brits are earning.
There are a few ways to view the data for the average pay in the UK, and the table below shows the most important ones from the latest ONS data.
| All employees | Full-time workers | Part-time workers | |
|---|---|---|---|
| Median average | £31,602 | £37,430 | £13,910 |
| Mean average | £38,224 | £45,836 | £16,830 |
Median average pay for all workers has grown by 7.1% from 2023 to 2024. Full-time roles saw an increase of 6.9%, whilst part-time employees saw a salary increase of 9.2% from 2023 to 2024.
For this analysis, we have reviewed median salaries as they are typically considered the most accurate way to view and compare this data. You can see how this compares over time, gender, and age in the full average salary analysis below.
What you need to know about the UK’s average salary
- The current median average salary for all workers in the UK is £31,602, which was a 7.1% increase from 2023.
- For full-time employees, the median average salary is £37,430, while part-time employees earn an average wage of £13,910 (including gig economy workers).
- The highest-paid job in the UK is chief executive and senior official, earning an average of £88,056.
- Cleaners and domestics statistically earn the lowest average salary in the UK at £22,961.
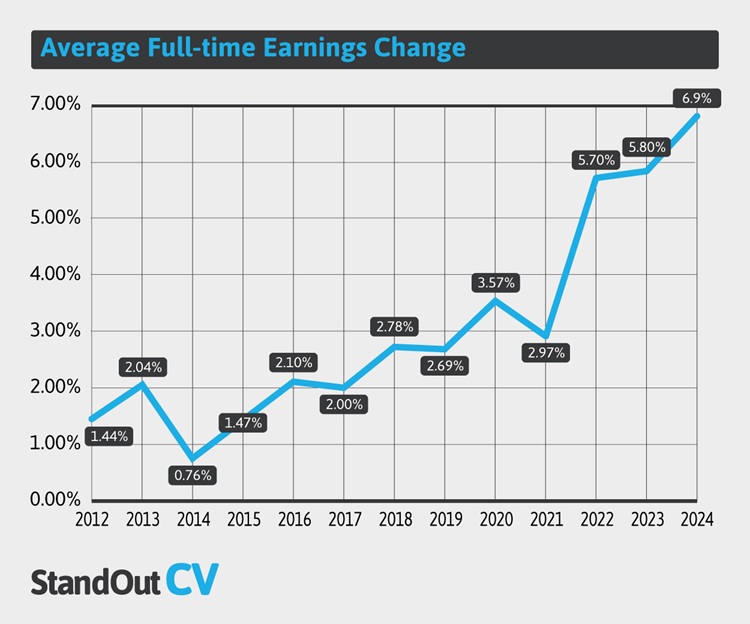
- 2024 saw the highest average annual earnings change at 6.9%, the biggest increase in over a decade.
- Across all workers, air travel assistants saw the biggest increase in earnings with a growth of 56% YoY to £30,115.
- Hire service managers and proprietors working full-time saw the largest decrease in median wages at -20.3%.
- In 2023, the gender pay gap decreased from 7.5% to 7% across full-time workers.
- Those aged 40-49 earn the highest average salary (£42,154) while those aged 18-21 earn the lowest: £22,001.
Average UK salary for full-time and part-time employees
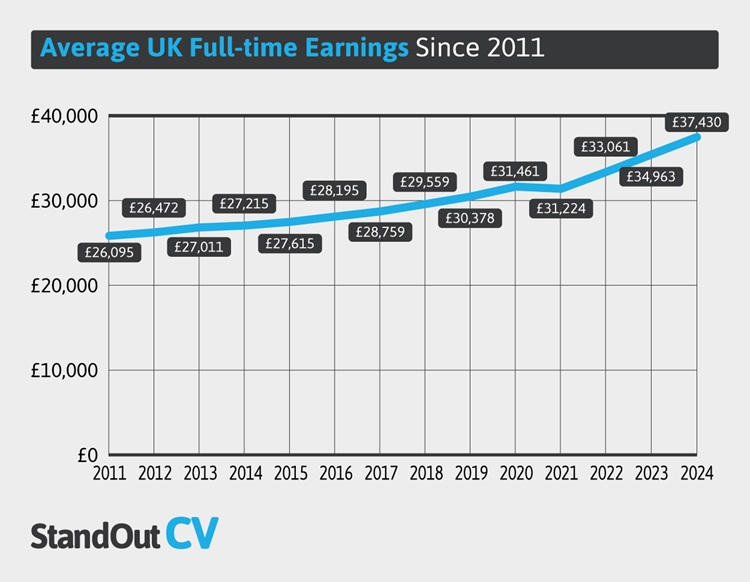
According to the ONS, the average salary in the UK in 2024 for all employees was £31,602, a 7.1% increase from 2023. For full-time workers, the average UK salary in 2024 was £37,430, a 6.9% increase YoY.
Part-time employees in the UK earned an average of £13,910 in 2023, which was a 9.2% increase from 2023. Part-time workers are defined by the UK Government as someone who works fewer hours than full-time workers at the same place of employment, therefore, part-time hours could typically range all the way up to 34 hours a week.
The chart below shows the average full-time earnings since 2011 in the UK.
Top paying industries in the UK
Below are the industries with the highest median annual earnings for full-time employees in the UK.
The electricity, gas, steam and air conditioning supply industry has the highest median salary at £67.611, followed by the financial and insurance industry with a median salary of £64,603.
| Industries | Median salaries for full-time employees |
|---|---|
| Electricity, gas, steam and air conditioning supply | £67,611 |
| Financial and insurance activities | £64,603 |
| Information and communication | £57,445 |
| Mining and quarrying | £54,859 |
| Professional, scientific and technical activities | £53,149 |
Which jobs pay the most in the UK?
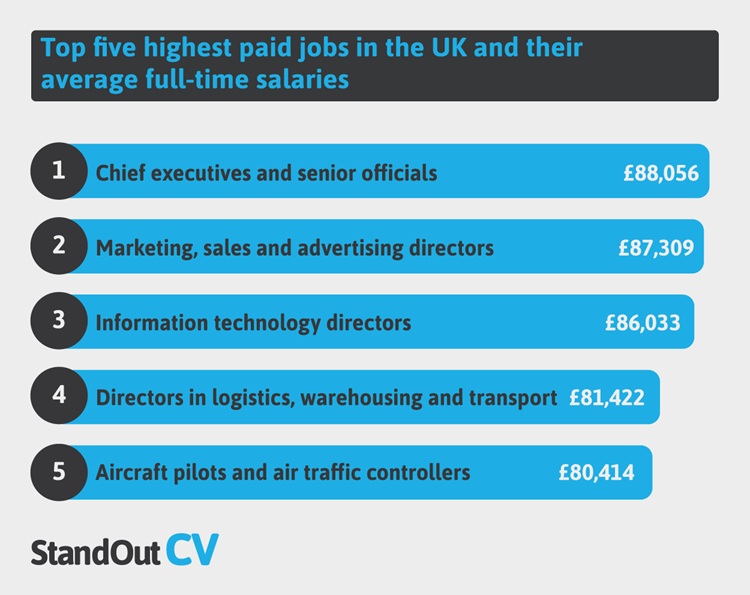
According to the latest Annual Survey of Hours and Earnings (ASHE) report by the ONS, CEOs (and similar) are paid the highest salary on average at £88,056. This is an increase of 4.5% compared to the same job’s annual median salary in 2023, and is 94.3% higher than 2024’s average salary in the UK.
This is followed by marketing, sales, and advertising directors, and information technology (IT) directors who are paid average salaries of £87,309 and £86,033 respectively.
The ONS classifies marketing, sales, and advertising directors as all one job, therefore salaries could vary drastically between those who hold a role that covers only marketing, or only sales for example.
In 2023, CEOs were also the highest-average earners with a reported annual salary of £84,131.
Highest paying jobs in the UK
When looking at median average salaries for full-time jobs in the UK, this is what the top five looks like.
You can see the full top 10 highest-paid jobs in the UK in the table below as well as how that salary has changed on average since 2023.
| Job Title | 2024 Salary | YoY Change |
|---|---|---|
| Chief executives and senior officials | £88,056 | 4.5% |
| Marketing, sales and advertising directors | £87,309 | 4.2% |
| Information technology directors | £86,033 | 6.6% |
| Directors in logistics, warehousing and transport | £81,422 | 13.1% |
| Aircraft pilots and air traffic controllers | £80,414 | 8.6% |
| Public relations and communications directors | £77,186 | -2.1% |
| Financial managers and directors | £75,093 | 6.8% |
| Specialist medical practitioners | £74,979 | 7.7% |
| Functional managers and directors n.e.c. | £74,666 | 2.8% |
| Head teachers and principals | £71,064 | 8.2% |
Average CEO salary in the UK
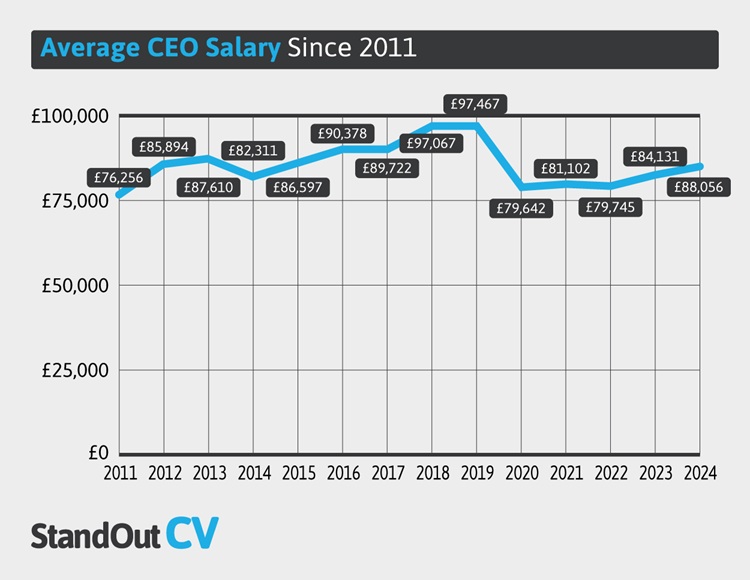
As the highest-earning job in the UK, we’ve analysed CEOs’ average salaries over time to see further insights that are not found in just one snapshot year analysis.
Despite being the highest earners in the country, CEOs have seen a 9.6% decrease in average salary from 2019 (£97,467) to 2024 (£88,056). The chart below reveals the annual average CEO salary from 2011 to 2024.
Average marketing, sales, advertising director salary in the UK
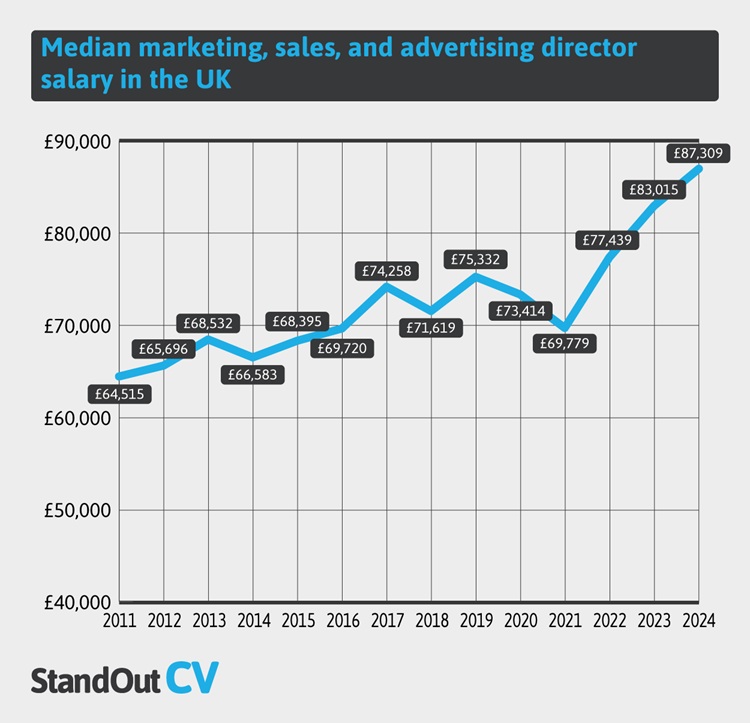
Historically, advertising/marketing/sales directors have been the highest-paid job when CEOs earned slightly less in a year. Due to this, it’s a job we track in our report each year to see how they perform over time too.
When reviewing the data it is important to note that before 2021, the ONS classed the role as ‘Marketing and sales director’ then advertising was added to the role in 2021 and 2022. This is likely due to marketing directors being responsible for paid marketing (advertising) more in recent years.
From 2011 to 2024 the average salary for marketing directors grew 35.3% from £64,515 to the current high of £87,309 in 2024. It’s important to note that the ONS periodically revises this dataset throughout the year as they gather more data, re-analyse their existing numbers, and sometimes fix errors, therefore this number is prone to change.
Which jobs in the UK have the lowest average salary?
In 2024, cleaners and domestic workers were the lowest-paid full-time employees earning an average full-time salary of £22,961, followed by fishmongers and poultry dressers (£23,267), and bar and catering supervisors (£23,421).
Lowest paid full-time jobs in the UK
The table below reveals the 15 lowest-paid jobs on average in the UK in 2023, with theme park attendants a new entry compared to 2022’s data.
| Job Title | 2024 Salary | YoY Change |
|---|---|---|
| Cleaners and domestics | £22,961 | 8.1% |
| Fishmongers and poultry dressers | £23,267 | 4.3% |
| Bar and catering supervisors | £23,421 | 3.8% |
| Receptionists | £23,595 | 8.6% |
| Animal care services occupations n.e.c. | £23,646 | 9.8% |
| Visual merchandisers and related occupations | £23,715 | 8.5% |
| Dental nurses | £23,727 | 8.9% |
| Sales and retail assistants | £23,878 | 12.2% |
| Elementary administration occupations n.e.c. | £23,891 | 4.7% |
| Higher level teaching assistants | £24,077 | 5.9% |
UK salary changes over time
At the end of 2024, the average full-time earnings in the UK increased by 6.9%, the highest earnings change increase in recent years, after a 5.8% increase in 2023. This is likely due to the lower figures recorded in the 2020/2021/2022 financial years due to the furlough scheme and the ongoing financial impacts of the pandemic.
Part-time salaries had an even bigger annual percentage change at 9.2% in 2024, while the overall average salary in the UK increased by 7.1%.
Jobs with the highest earnings growth
By analysing full-time earnings data from 2024 we can see which roles had the highest percentage increase change in their average salaries year-on-year. We’ve broken this down by both full and part-time jobs.
The biggest salary jump across all employees was found in those who work as air travel assistants; these workers saw a huge 56% increase in their earnings in 2024 up to £30,155. Those employed as exam invigilators saw the second-highest jump at 39%, followed by prison service officers (23.3%).
| Job Title | 2024 Salary | YoY Change |
|---|---|---|
| Air travel assistants | £30,115 | 56% |
| Exam invigilators | £2,393 | 39% |
| Prison service officers (below principal officer) | £36,706 | 23.3% |
| Sheet metal workers | £31,455 | 21.6% |
| Cleaning and housekeeping managers and supervisors | £22,294 | 21.5% |
| Water and sewerage plant operatives | £37,673 | 21.4% |
| Pipe fitters | £46,047 | 21.1% |
| Managers and proprietors in other services n.e.c. | £38,071 | 20.7% |
| Education advisers and school inspectors | £38,382 | 20.7% |
| Health associate professionals n.e.c. | £25,994 | 19.9% |
Full-time jobs with the highest earnings growth
When looking at the full-time jobs with the highest growth in earnings, complementary health associate professionals saw an increase of 39.1% YoY with a median salary of £29,150 in 2024. People in these roles typically offer non-mainstream treatments alongside conventional medicine.
Other full-time jobs which saw large salary growth in 2024 include clinical psychologists (30.5%), florists (30.1%), and prison service officers (29.4%).
| Job Title | 2024 Salary | YoY Change |
|---|---|---|
| Complementary health associate professionals | £29,150 | 39.1% |
| Clinical psychologists | £45,831 | 30.5% |
| Florists | £22,426 | 30.1% |
| Prison service officers (below principal officer) | £38,795 | 29.4% |
| Leisure and theme park attendants | £22,386 | 25.1% |
| Artists | £38,169 | 24.1% |
| Shelf fillers | £25,736 | 21.3% |
| Children’s nurses | £40,755 | 21.3% |
| Retail cashiers and check-out operators | £22,600 | 21% |
| Sheet metal workers | £31,686 | 19.5% |
Part-time jobs with the highest earnings growth
When it came to those who work part-time hours (anything fewer than full-time hours at the same business) air travel assistants had the biggest percentage change (63.9%) in their 2024 pay up to £30,692. This was followed by exam invigilators (35.7%) and part-time higher education teaching professionals who saw their salary bumped 32.3% to £18,047.
| Job Title | 2024 Salary | YoY Change |
|---|---|---|
| Air travel assistants | £30,692 | 63.9% |
| Exam invigilators | £2,329 | 35.7% |
| Higher education teaching professionals | £18,047 | 32.3% |
| Road transport drivers n.e.c. | £13,423 | 25.5% |
| Sports coaches, instructors and officials | £5,776 | 21.3% |
| Library clerks and assistants | £12,023 | 19.2% |
| Pensions and insurance clerks and assistants | £19,683 | 19% |
| Buyers and procurement officers | £21,402 | 18.9% |
| Caretakers | £11,888 | 18.8% |
| Business and related research professionals | £21,225 | 18.2% |
Jobs with the highest earnings decline in 2024
The average pay across the UK saw a 7.1% increase, however there were a number of roles that did not follow this trend, and to an even worse extent, suffered a decline in average wages when compared to 2023.
Full-time jobs with the highest earnings decline
Those working full time as hire service managers and proprietors in the UK saw the largest percentage salary decrease in 2024 of 20.3% to £29,272 out of any other job analysed by the UK Government. Newspaper and periodical journalists and reporters had the second largest decrease in salary of 19.1% followed by those working as therapy professionals at 7.8%.
The below table reveals the top ten full-time jobs in the UK that suffered the highest percentage decrease in average pay.
| Job Title | 2024 Salary | YoY Change |
|---|---|---|
| Hire services managers and proprietors | £29,272 | -20.3% |
| Newspaper and periodical journalists and reporters | £34,026 | -19.1% |
| Therapy professionals n.e.c. | £31,804 | -7.8% |
| Probation officers | £35,658 | -7.7% |
| Newspaper and periodical editors | £39,555 | -6.9% |
| Mental health nurses | £41,664 | -6.1% |
| Health care practice managers | £40,351 | -5.5% |
| Childminders | £20,189 | -5.4% |
| Other educational professionals n.e.c | £40,633 | -5.3% |
| Other psychologists | £33,346 | -5% |
Part-time jobs with the highest earnings decline
When it came to part-time employees, specialist medical practitioners saw the largest earnings decline in 2024 of 33.8% to an average of £48,844. This was followed by industrial cleaning process occupations (-18.9%) and legal professionals n.e.c. (-12.4%).
You can see the top ten part-time jobs in the UK ranked by their average salary decline in the table below.
| Job Title | 2024 Salary | YoY Change |
|---|---|---|
| Specialist medical practitioners | £48,844 | -33.8% |
| Industrial cleaning process occupations | £9,112 | -18.9% |
| Legal professionals n.e.c. | £18,917 | -12.4% |
| Project support officers | £15,724 | -11.7% |
| Public services associate professionals | £21,416 | -8.7% |
| Clinical psychologists | £37,688 | -5.4% |
| Head teachers and principals | £60,929 | -5% |
| Legal associate professionals | £17,301 | -5% |
| Retail cashiers and check-out operators | £9,643 | -4.8% |
| Medical radiographers | £25,807 | -4.4% |
The national living and minimum wage in the UK
The national living and minimum wages in the UK
The National Living Wage in the UK as of April 2025 is £12.21 for people aged 21 and over, an increase of 6.7% from £11.44 in April 2024.
For those of school leaving age but under age 21, the National Minimum Wage is £10 for 18 to 20s, and £7.55 for under 18s or apprentices. [2]
UK gender pay gap 2024
The latest ONS data reveals that, as of 2024, the gender pay gap for full-time workers is 7% in favour of male workers, down from 7.5% in 2023.
The data shows that full-time median hourly earnings (excluding overtime) for men were £19.24 and £17.44 for women.
When it comes to part-time work, the difference is in favour of female workers as they earn 3% more (£13.40 per hour compared to £13 per hour for men). This is likely due to the fact that more women are employed in part-time roles than men (36% vs 14%).
The gender pay gap among all and full-time employees has slowly declined over time, falling by around a quarter in the last ten years. [3]
Highest earning professions in the UK by gender
Below you can see the highest-earning professions for both men and women in the UK in 2023 based on full-time salaries.
| Male | Female | |||
|---|---|---|---|---|
| Job title | Average salary | Job title | Average salary | |
| Chief executives and senior officials | £95,771 | 1 | Marketing, sales and advertising directors | £78,803 |
| Marketing, sales and advertising directors | £90,901 | 2 | Directors in logistics, warehousing and transport | £78,402 |
| Information technology directors | £88,956 | 3 | Chief executives and senior officials | £75,267 |
| Financial managers and directors | £86,188 | 4 | Information technology directors | £75,196 |
| Aircraft pilots and air traffic controllers | £82,494 | 5 | Head teachers and principals | £68,992 |
| Public relations and communications directors | £82,039 | 6 | Functional managers and directors n.e.c. | £68,168 |
| Directors in logistics, warehousing and transport | £80,806 | 7 | Specialist medical practitioners | £67,142 |
| Specialist medical practitioners | £80,583 | 8 | Public relations and communications directors | £67,126 |
| Functional managers and directors n.e.c. | £79,137 | 9 | Train and tram drivers | £65,042 |
| Head teachers and principals | £74,878 | 10 | Professional/Chartered company secretaries | £61,980 |
Average UK salary by age
As you age and spend more time in an industry, accruing more and more experience in your career, your value to employers naturally increases, and at the same time your expectations probably follow suit.
This is evident in the latest data which shows that full-time workers aged 40-49 are the highest earners in the UK, with a median salary of £42,154, an increase of 6.3% from 2023, with those below this age bracket “working their way up”.
Those aged older, in their 50s and above, see a reduced salary as people begin to take retirement or reduce hours as the need for money is typically reduced with children leaving home for example.
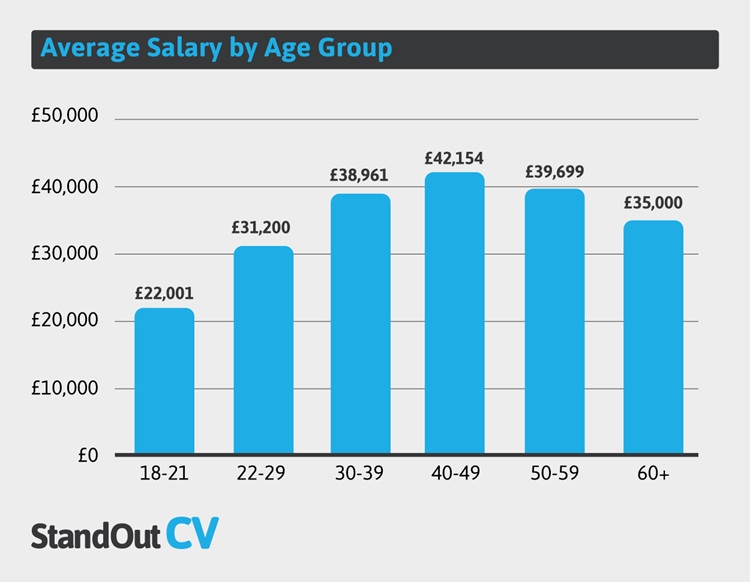
In comparison, those aged under 21 and in full-time work earn over £20,000 less than that of 40-49-year-olds. Year-on-year we can see that all age groups have seen an increased average salary, with those under 21 seeing the largest increase (9.1%).
Methodology
Data was sourced and analysed from the latest Annual Survey of Hours and Earnings (ASHE) report by the Office for National Statistics (ONS). Where duplicates or similar descriptions were used for roles, the highest value was retained and used in the analysis. Job titles were amended by our analysts when reviewing the ONS data to ensure clarity and consistency across our data.
Sources
[1] Office for National Statistics, ‘Employee Earnings in the UK: 2024’ (https://www.ons.gov.uk/employmentandlabourmarket/peopleinwork/earningsandworkinghours/bulletins/annualsurveyofhoursandearnings/latest)
[2] UK Government, ‘National Minimum Wage and National Living Wage Rates’ (https://www.gov.uk/national-minimum-wage-rates)
[3] UK Government, ‘Gender Pay Gap in the UK’ (https://www.ons.gov.uk/employmentandlabourmarket/peopleinwork/earningsandworkinghours/bulletins/genderpaygapintheuk/2024)